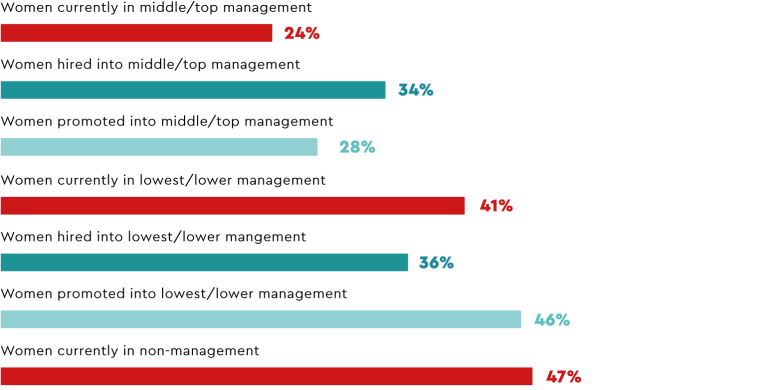
There is a relatively balanced distribution of men and women in non-management and lowest management positions of the Service sector. At all other hierarchical levels, the percentage of women remains relatively stable, but at much lower levels. The most significant drop in the percentage of women managers is between the lowest and lower management levels. This drop suggests that it may be difficult for women to move beyond the lowest management level.
This sector encompasses a wide range of companies, leading to significant variations in gender representation, mostly in non-management and lowest management. The median values often differ from the average, mainly due to the presence of outliers, highlighting the diversity of experiences within the sector.
More women enter the lowest/lower management level through promotions than through recruitment. The opposite is true for middle/top management. It is thus likely that some internal female talents in both non-management and lowest/lower management still need to be recognized and move up the management ladder.

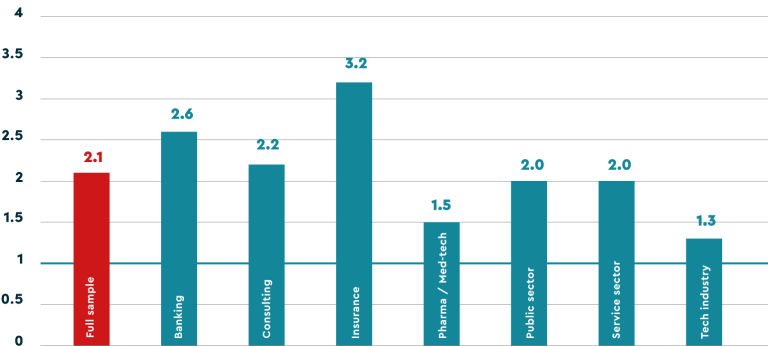
The Glass Ceiling Index of 2 for the Service sector implies that women in this industry face significant difficulties reaching upper management levels.

Although the variations are relatively small, the higher the management level, the higher the average employment percentage of women. The option of working part-time – even in a non-managerial role – seems to be more readily available to women than to men.