Men have held (most of) the power for millennia. While women’s share of management positions has incrementally increased over the last few years, the power imbalance stubbornly persists.
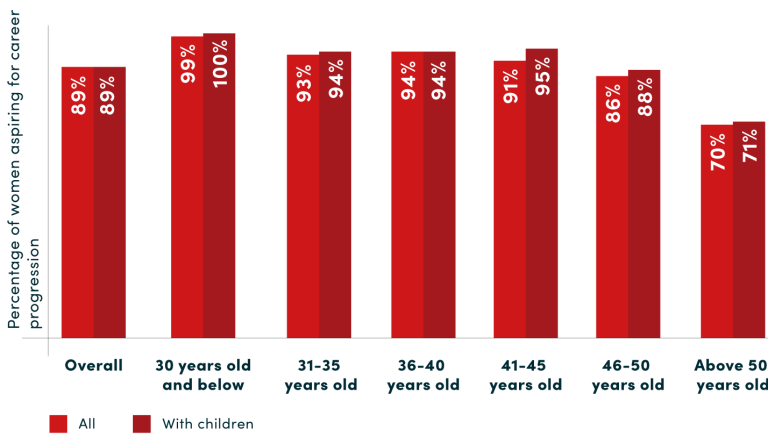
Why are women still looking from the outside in when it comes to power? After all: A dedicated survey of over 1,200 professional women in Switzerland, conducted in 2024 by Advance in collaboration with EY Switzerland and the CCDI, found that approximately 90% of the women surveyed desire career advancement across all age groups. This contradicts the assumption, particularly about women of childbearing age and those who have (smaller) children, that they are not inclined to take on leadership responsibilities. This begs the question: What is keeping women out of power, and men in power?
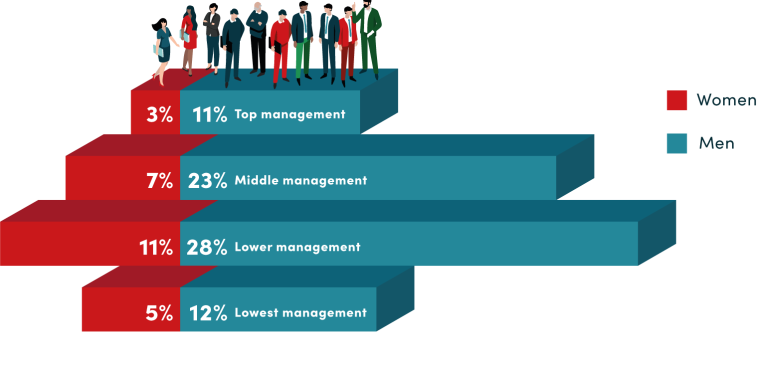
The key figures paint a clear picture: Women are (heavily) underrepresented in positions of power. They make up only about a fifth of top management positions in the Swiss workplace. Progress remains slow: Increases between zero and two percentage points per management level indicate that the needle moved only slightly compared to last year.
To show progress over time and allow for accurate comparability, we created a sub-sample of 71 companies with 305,600 employees’ HR data from companies that participated in the report in both 2023 and 2024.
Even more striking: Men are still very predominant in power positions. This report applies the term “power positions” to roles with the power to make key decisions, plot strategy, steer financial flows, and influence a wider circle of stakeholders. Such roles are measured by the indicator “personnel responsibility” in the data analyzed, as such roles are likely also to comprise profit and loss responsibility and are often career-critical.
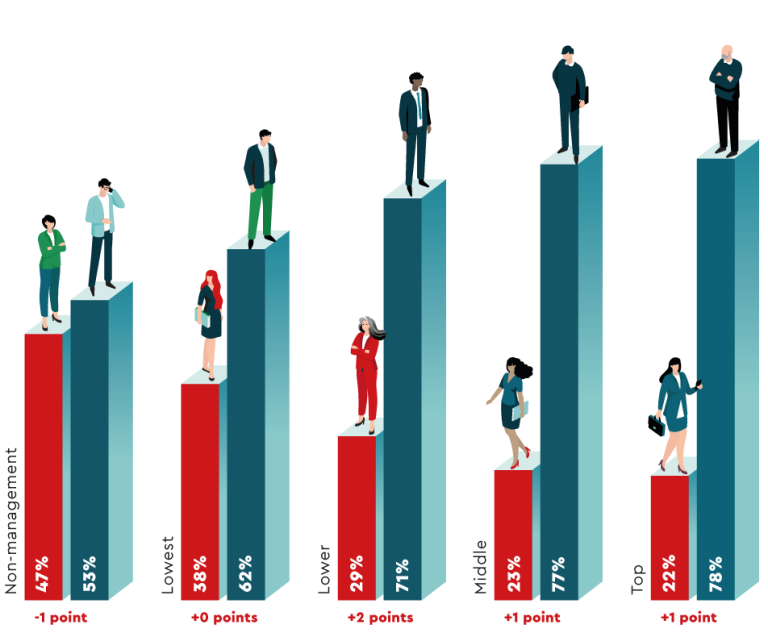
Among GIR companies, women hold just 27% of power positions. There is only a small share of such positions in the lowest management, while the bulk is in lower and middle management. On these levels, women are strongly underrepresented. In middle and top management power positions, men’s share is more than three times the share of women. And: A recent analysis of almost 1000 large companies around the world showed that women hold just 29% of revenue-generating management roles. These kinds of roles can be steppingstones to the C-suite as they can provide experience in running businesses or making operational decisions (Hall et al., 2024).
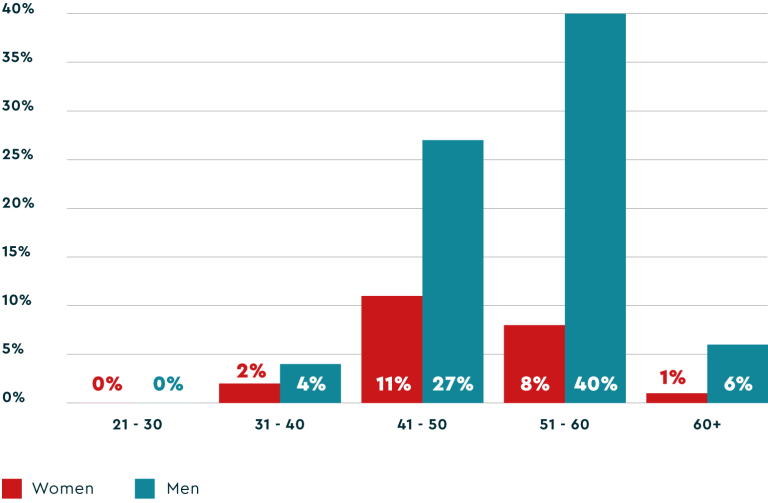
Over the age of 40, men outnumber women in power positions three- to four-fold. However, looking at younger generations of leaders and taking an intersectional perspective on individuals in power positions, we see somewhat more gender diversity – below 30, men and women are equally represented (though few employees under 30 hold such roles). Between 31 and 40, twice as many men as women have personnel responsibility. At least at this level, they are above the critical threshold of one third representation where they can affect the (inclusion) culture for the better (Kanter-Moss, 1977).
Is the future of business leadership more (gender) diverse? Are there indications that point to cultural change when it comes to gender and other forms of diversity? The answer is a qualified “yes”. For one, younger women are as well or better educated than their male counterparts. In the age group of 50 and older, there is a significant education gap of 22 percentage points: 42% of women and 64% of men hold a tertiary degree. In contrast: There are as many women as men with a tertiary degree (45% each) in the age group 30 and younger. In fact, by now, there are more women than men completing their education with a tertiary degree. This indicates that the talent pipeline to the very top is brimming with young, female talents – but it is up to companies to make use of this opportunity.
Are companies making use of this opportunity? Overall, there are considerably more men than women newly hired and promoted to power positions.
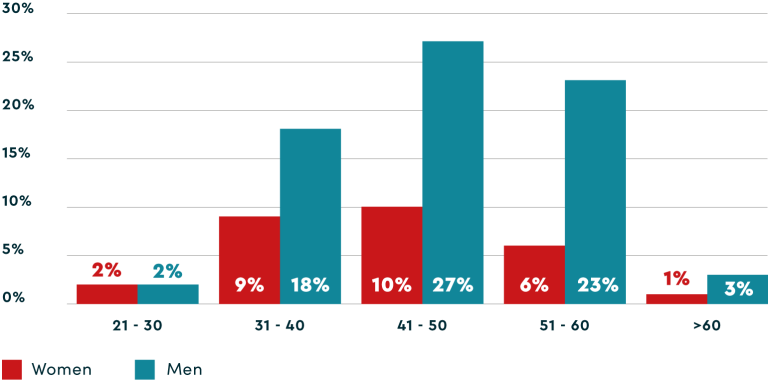
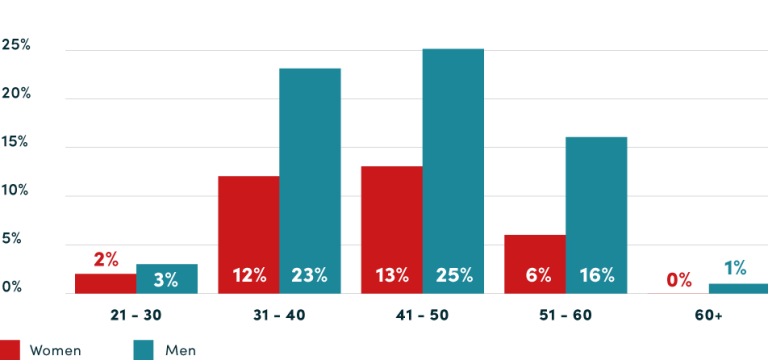
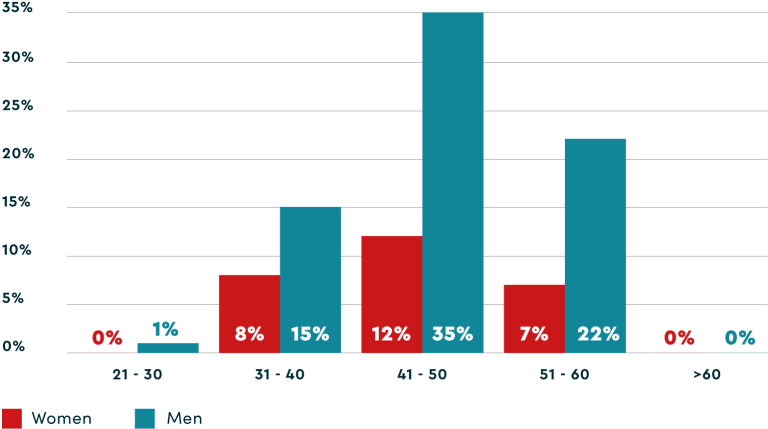
Looking at how the power position pipeline has developed via hiring reveals significant discrepancies between women and men, except in the youngest age bracket, which only makes up 5% of all hires to power positions. The gap opens widely after 30.
Due to the mathematical rounding of each bar (.5 and higher are rounded up, below .5 is rounded down), the total amounts to 101%.
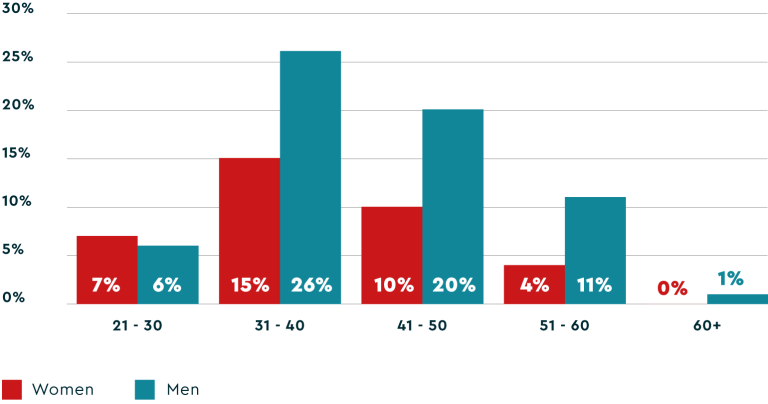
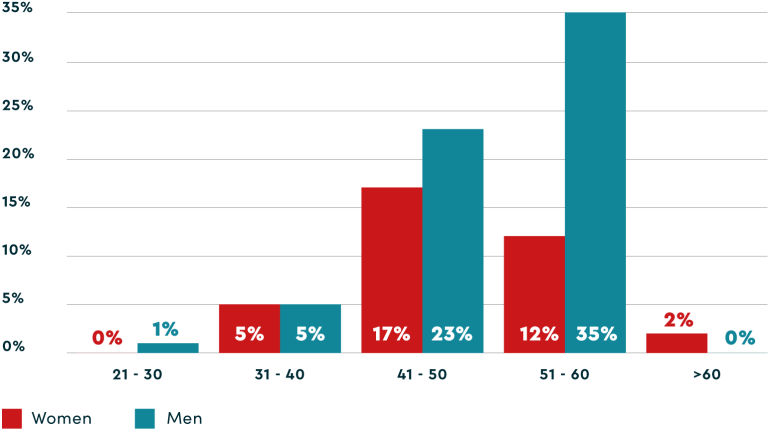
Compared to their representation in the talent pool, men are strongly overrepresented in promotions to power positions. This is most pronounced in the age brackets 31 to 40 and 41 to 50, where most promotions happen. The exception is between 21 and 30. In this age bracket, women get promoted into power positions even slightly more than men. This is a silver lining on the horizon, indicating that the younger generations may move the needle – provided both genders have the same career opportunities across life phases.
Some good news: There are more young employees promoted to power positions, compared to the existing age distribution. This indicates that age diversity might be increasing!
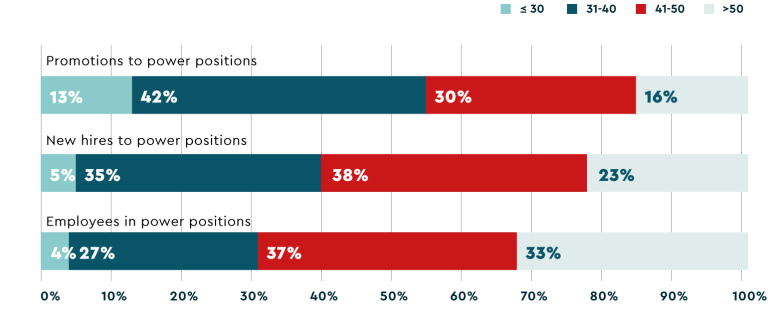
Even so, the lion’s share of promotions into power positions happen between 30 and 40, right around “family primetime.” 42% of all promotions to power positions go to employees aged 31 to 40 (even though only 27% of employees fall into this age category). The same is true for 35% of new hires. This falls squarely within family primetime, i.e. when Swiss people on average have their first child at the age of 31, which disadvantages employees with care responsibilities (FSO, 2023).
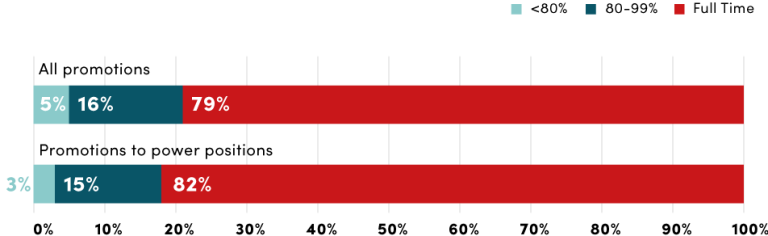
The power system is skewed towards employees able to focus on work full-time (or more than full-time): While 56% of all women work full-time, the same is true for 85% of those newly hired into power positions, with the vast majority of “part-timers” working 80% or more. This means that women would have to significantly increase their work percentage to take on a leadership role, while for men, it would be just business as usual. It is also notable that this perfectly dovetails the work percentage distribution of men, who seemingly do not have to adapt their work percentage to take on a power position. In other words, the male career model still rules the (power) game.
Again, the silver lining is the age group between 21 and 30: There is hardly any gap in the average employment percentages of women and men between 21 and 30 (three percentage points). From age 31 onwards, the gender divide regarding full-time vs. part-time begins, amounting to a 12-percentage point difference in the age bracket from 31 to 40 and 15 percentage points in the age bracket 41 to 50.
To understand how the prevalent norms in the power structure of Swiss business came to be, we have to take a closer look at the typical “business leader” in Switzerland. In our GIR dataset, this means looking at top management, a hierarchy level that includes C-suite, managing directors, and their peers. Many of us associate these decision-makers with a White[1]man who is Swiss-born and / or German speaking, typically over the age of 50, able-bodied, and works full-time. The data confirms this:
[1] The term “Black” is not an adjective or a color designation, but a political and cultural self-designation of Black people, so “Black” should definitely be capitalized in this context (GRA). We capitalize “White” as well, following the explanation of sociologist Eve Ewing: “Whiteness is not incidental. Whiteness is a thing. Whiteness is endowed with social meaning that allows people to move through the world in a way that people who are not white are not able to do” (quoted by Eligon, 2020). Learn more here.
Due to the mathematical rounding of each bar (.5 and higher are rounded up, below .5 is rounded down), the total amounts to 99%.
With 55% of all top managers over 50, several thousand top management positions will be vacated in the coming 5 to 10 years. This is a tremendous opportunity for conscious succession planning now to not only start closing the power gap but also to see the diverse and inclusive leadership that has the potential to deliver sustainable solutions and mitigate risks. Now is the time to think about what the top management of the future should look like in terms of diversity – both in terms of demography as well as values, competencies, perspectives, experiences, etc.
When it comes to promotions to top management positions, women are still outpaced by men 3:1 in the age group from 41 to 50. The better news is that the promotion gap between 31 and 40 between genders is considerably smaller, which indicates a certain generational change with who becomes a leader.
Even more encouraging are the numbers for new hires: Although there are few external top management hires between 31 and 40, they are very gender balanced. And between 41 and 50, women are hired at almost equal rates as men, though the gap is considerably wide post age 50 (note that external top management hires tend to be older than employees promoted to the same positions). For both hires and promotions to top management, the “new leaders” are more gender- and age-diverse than top management incumbents.
This image of the “typical leader” also excludes men who do not fit into the categories above. Because older White men have been dominant so long, our understanding of power has been shaped by one relatively homogenous group. This notion continues to bear the burden of historical White, able-bodied male dominance, still evident in our present-day organizational frameworks (Livingston & Rosette, 2021).
This has excluded not only women and other marginalized groups but also men who do not align with the classifications listed earlier. (Dyke & Murphy, 2006). For example:
Our narrow conceptions of what a leader looks like limits these groups’ ability to pursue their careers, in part because the prevalent (business) norms and expectations, images, and biases are deeply anchored in the prevalent power structure.
All factors taken together culminate in a big financial power gap. On average, women’s gross salaries are 16% lower than those of men. Here, too, the power gap increases with hierarchy level: The higher the professional position, the greater the difference between the average gross salaries of men and women. Starting at a 7% difference in gross salary at the non-management level, it rises to a stark 18% in middle and top management.
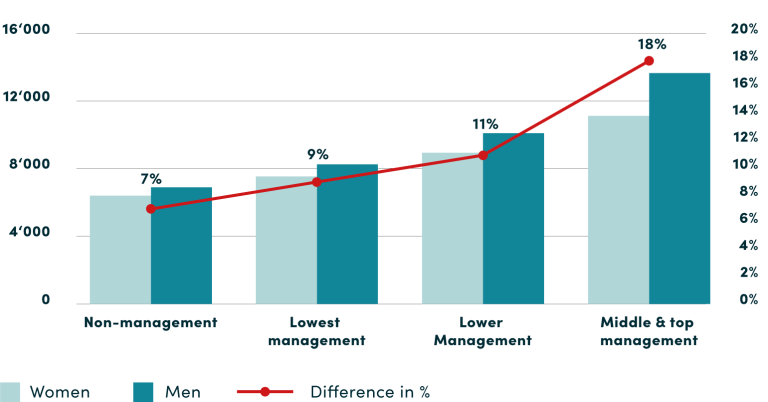
Source: Swiss Earnings Structure Survey (ESS), Federal Statistical Office (FSO), 2024
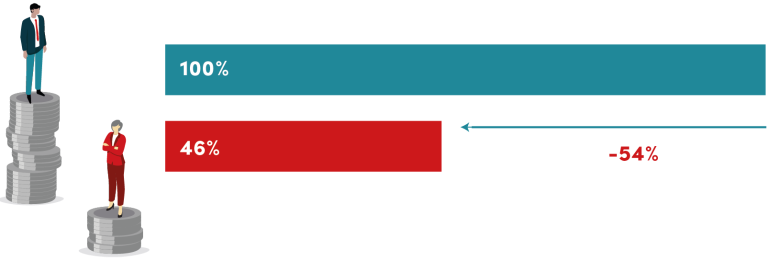
This is even more pronounced, if we look at bonuses[2] as a condensed expression of perceived employee value, range of power, influence, and appreciation.
If we compare the average bonuses received by men and women in 2022, there is a difference of 54%. If we extrapolate the average bonus difference for all women and men working in Switzerland, taking into account their respective levels of employment, the difference amounts to around 13 billion Swiss francs – annually.
[2] Payments that are paid irregularly, for example bonus payments, gratuities, profit- or revenue-sharing bonuses, entry and severance payments or loyalty bonuses are considered.
While women in lowest management are already receiving on average almost 25% lower bonuses, in top management, the difference is almost 40%. The big bonus difference in non-management indicates that men are more often in valued and financially rewarded jobs and positions than women. Moreover, these jobs and positions feed more easily into future power positions. If we do not change the system so that women get a real chance to attain power positions, reaching gender equity will remain difficult.
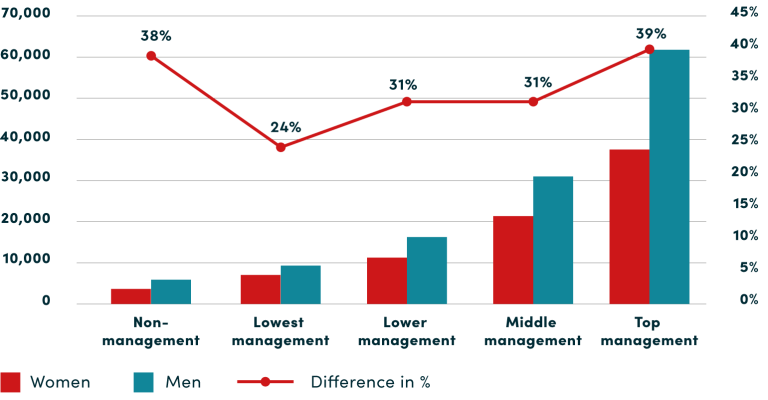
Source: Swiss Earnings Structure Survey (ESS), Federal Statistical Office (FSO), 2024
Regarding the development of the bonus gap across age groups, it is already substantial in younger ages and peaks between 50 and 64/65 and goes as high as 65%.
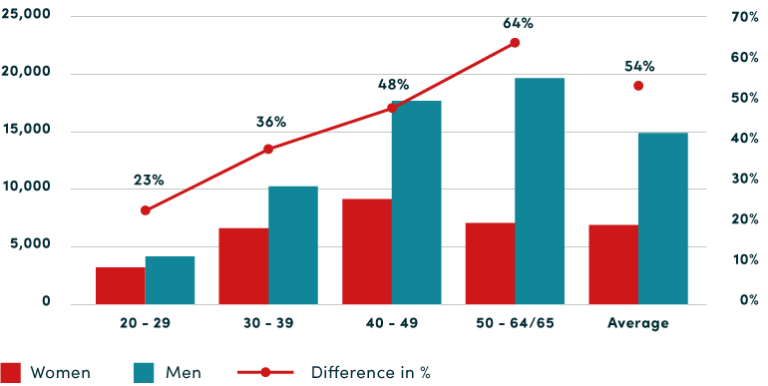
Source: Swiss Earnings Structure Survey (ESS), Federal Statistical Office (FSO), 2024
Biases and stereotypes about who is considered “powerful” reinforce the power gap. Our biases and prejudices tend to reinforce pre-existing power dynamics by coding them as typical and then make decisions to fit (Kanter-Moss, 1977). An example: If a hiring manager is male, he may recruit or promote a male candidate with similar characteristics to himself because he subconsciously associates these with what a leader looks like (similarity bias) (ibid).
If older, White, educated men who work full time are considered the epitome of “powerful”, we are more likely to judge them as suitable for powerful positions. A recent MIT study based on 30,000 management-track employees at a large North American retail chain showed: Women received higher performance ratings than male employees but received 8.3% lower ratings for potential than men. The result was that female employees on average were 14% less likely to be promoted than their male colleagues (Somers, 2022). Potential ratings, which are much less likely to be based on measurable, specific criteria than performance ratings, are still overwhelmingly used to determine whether employees are considered “talents”(ibid).
Biases also make it so women cannot win: The same trait that appears positive in a man might appear negative in a woman. For instance, when a man asks for a promotion, it is seen as assertive and ambitious. If a woman makes the same request, she may be viewed as pushy or demanding. Similarly, a man who confidently voices his opinions is considered strong and decisive, while a woman doing the same may be labeled as aggressive or bossy (Gross, 2023; Tiwana, 2016). This is the so-called “double-standard bias” at work, defined as “the use of different requirements for the inference of possession of an attribute, depending on the individuals being assessed” (Foschi, 2000). Status characteristics (gender, race, socioeconomic background…) become a basis for applying stricter standards for the lower status person. The double standard bias is well documented for the evaluation of women’s (versus men’s) work (Cecchi-Dimeglio, 2023).
Patriarchal attitudes also play a key role here. These refer to normalized and learned beliefs and behaviors that often manifest in actions privileging men and disadvantaging women (Adisa et al., 2019). These attitudes emphasize a hierarchical bias that undervalues women’s voices. For example, women are often interrupted during meetings, their opinions are frequently disregarded, and their contributions only gain recognition when echoed by a male colleague. Such behaviors can lead women to experience gaslighting, where they begin to doubt their own perceptions and contributions due to the persistent undermining and devaluation of their input (Mallick, 2021; Westover, 2021).
None of this is to say that individual choices don’t matter. Women and men do still make different choices when it comes to field of education, acquisition of financial literacy, or career tracks, to name just a few.
A key root cause of the power gap is financial literacy. In Switzerland, there is a notable lack of financial literacy among women and marginalized groups (Klatzer et al., 2018; OECD, 2023). In the context of power, this literacy refers to both professional and personal settings and is the knowledge that comes with financial management, budgeting, and investing. This knowledge is extremely important in a pathway to financial independence, stability, and empowerment. Financial literacy empowers individuals by equipping them with tools vital for the future.
On financial literacy tests conducted in the German-speaking part of the country, women tend to perform over 50% worse than men and are much more likely to answer “I do not know” to questions than men (Kendzia & Suozzi Borrero, 2022).
Both personally and professionally, those who are financially literate are more likely to have control over financial situations and are able to have an impact on economic policies and development (Hung et al., 2012). The good news: In Switzerland, there are finance platforms like Ellexx and Smartpurse which offer financial planning education, tools and investment support to women to confidently manage their finances. Learn more from Johnson&Johnson’s best practice!
This issue is also reflected in educational choices, where STEM subjects are still perceived as male domains. In 2022/2023, women made up 35% of MINT students at university level (FSO, 2024a) though there are considerable differences between different fields: In chemistry and life sciences, well over half of students are female (57%), whereas the same is true of only 16% of all information technology students and 18% of tech students (ibid). Also interesting: The share of Swiss women is lower than the share of foreign women across all MINT subjects (ibid). In economic sciences, women make up 36% of students at universities (FSO, 2024b). Such early specialization perpetuates existing power dynamics related to gender roles, reinforcing the imbalance. For example, it may not be as easy as motivating more girls to study STEM subjects, or encourage young female talents in banking to study for the CFA. Research shows that when women enter fields in greater numbers, pay declines — for the very same jobs that more men were doing before (Levanon et al., 2009; Miller, 2016).
Women are strongly underrepresented in profit and loss (P&L) responsibility and positions with personnel responsibility. Why? Women often choose career tracks that do not feed into future roles with significant responsibility – HR, legal, communications, etc. These choices are path dependent – for example, escalating levels of P&L experience are a must-have qualification for high-level executive and C-suite roles (DDI’s 2020 Global Leadership Forecast project). Consequently, those without P&L roles find themselves at a disadvantage within the system. Is the answer for why there are not more women in leadership roles simply – that they made the wrong career choices?
While this may be part of the answer, the question remains “why”. Women often do not receive the knowledge and mentoring necessary to learn P&L management skills (Robinson, 2023). A representative survey of US men and women in business found that only 14% of women — compared to 46% of men – were actively encouraged to consider P&L roles, and the same survey found men to be over three times as likely to be well-informed about career paths to P&L roles in their respective companies (Seramount, 2019). Siemens provides a good example for supporting women to make well-informed career choices.
While blaming gender inequality in money and power on individual choices is a simple yet tempting perspective to take, individual choices are never made in a vacuum, but inside of an existing power system. The power system was made for men, by men – this is not about “fixing the women”. However, raising awareness for the consequences of these individual (career or education) choices could still lead to them being taken more consciously.